
Group Members
Christofer Gass: Lead Developer, Lead UX Designer
Christofer contributed to the Heritage Reconstructed project as a Lead Developer and Lead UX Designer. His roles consisted of working on the website, adding sites to the Omeka database and creating the map in Tableau. He also assisted with research, along with other group members.
Marcela F. González: Research/Documentation
Marcela contributed to the Heritage Reconstructed project through research and documentation. She gathered the data for the sites that we put into the database. In addition, she gathered data for sites that were in peril but did not have virtual reconstructions so that we can compare the two data sets and represent the importance of virtual reconstructions for such sites.
Margael St Juste: Social Media and Outreach
Margael was the outreach coordinator for the Heritage Reconstructed project. She was in charge of email communications with academics and digital scholars, including those whose work serves as the foundation of our project. In addition, she promoted public conversation about the project on social media platforms as well as within digital humanities spaces.
Ashley Rojas: Project Manager, Developer, UX Designer
Ashley was the Project Manager for Heritage Reconstructed, as well as one of the Developers and UX/UI Designers. As Project Manager, she ensured the group remained organized and on task as well as providing support for all areas of the project that needed assistance. As a Developer, she worked on the website and database. As a UX/UI Designer, she made sure that Heritage Reconstructed reached its intended audience through design and representation.
We have also received assistance throughout the semester from the following Graduate Center faculty and staff: Dr. Bret Maney, Professor Lisa Rhody, Steve Zweibel, Micki Kaufman and Jason Nielsen.
Project Narrative
Within the world of archaeology, combining virtual reality with archaeological data has allowed individuals to experience cultures that are no longer around today. Such projects include Learning Sites Inc., Project Collart-Palmyre, and Google Arts and Culture: Open Heritage. Many projects, however, are not openly available to the public. In addition, there is not a large focus placed on the virtual reconstruction of archaeological sites. Sites that we are at risk of losing due to factors such as political unrest, warfare, and environmental impact, should be the ones focused on when institutions or companies are looking to create virtual reconstructions. The goal of Heritage Reconstructed: Virtualizations of Archaeological Sites in Peril is to allow for an online open database to hold virtual reconstructions of archaeological sites that have already been digitally reconstructed and have either been destroyed or are in peril. It will also look at the sites that are classified as in peril but have not been virtually reconstructed to see the scope of sites that should be focused on. Heritage Reconstructed will not only be for academic or scholarly use, but to be used in pedagogy and for those who may have an interest in the topics who either do not know where to start, or do not have access to the information outside of academia.
Virtual reality methods have been used for almost three decades in the field of cultural heritage, specifically, for the reconstruction, visualization, and interpretation of archaeological sites. The Heritage Reconstructed database is organized following two selection criteria: first, we focused on archaeological sites — sites that required human intervention and may include cultural artifacts, architecture, art, religious buildings and objects — as opposed to natural sites (such as national parks). Second, we focused on archaeological sites in peril due to armed conflict, terrorism, war, and environmental damages such as natural disasters and pollution. This delimitation of the scope of the sites that we include in our database is important because it gives our project a strong, conceptual lens and a clear standpoint to engage our VR digital project with others that are already being developed by different individuals and institutions: scholars in universities, people in the game industry, artists, start-ups, among others.
Our digital project engages with different digital projects built by institutions and individuals whose aim is pretty close to our aim, for example, ICONEM, which is dedicated to the digitization of endangered cultural heritage sites; Rekrei, a crowdsourced project, which also creates 3D representations of sites in danger; CyArc-ICOMOS-Google which created five VRs of sites taken from World Heritage In Danger (UNESCO) list that are mostly in danger due to climate change. Unlike these organizations, we are not creators of VRs, but we built a database of VRs that amplifies and enhances their work. In a sense, our digital project differs from others because we see ourselves as facilitators of conversations and enablers of future projects by putting together and disseminating VRs that are either private or public but isolated from one another.
Additionally, our broader perspective of the field of virtual reconstruction of archaeological sites in peril allows us to identify what has been done, and more importantly, what still needs to be done. Our main reference for this was the UNESCO In Danger list because we had already identified many sites considered archaeological sites in peril for which there are no VRs available, at least to the best of our knowledge. Our work in identifying archaeological sites in peril for which there are no VRs, however, is not limited to those sites included in the UNESCO In Danger list. Our work goes beyond this list. This is an important contribution we aim to make in the field; by identifying archaeological sites in peril that have yet to call attention to any institution or individual yet.
Audience
The idea of ‘audience’ was central to how we executed our vision of Heritage Reconstructed. From the day we sat down to discuss the project we were already thinking about the user on the front-end of a computer screen and how our project would serve them. We continuously questioned for whom we were building this project, where will we find them, and how will they find our project? In one of our earliest class meetings, Professor Lisa Rhody had urged us to think about the audience as a guiding element of our design process. If we could identify our primary audience, we could envision them as individual users. We could picture what we would want them to experience. Using our primary audience to guide our design process helped us to clarify some important goals very early on. Even when we struggled in other aspects, like task completion, having clear goals helped us to see the bigger picture and move forward.
Because the concept of audience was tied-in very early in the development process, it became instrumental to our decision making. Questions such as where to host our database, what design elements to choose or discard, and how to connect the features of our website to tell a story our audience will understand were all contingent on who we believed our audience to be. One such feature was incorporating our Twitter feed on our website, another was hosting our database on Omeka.net to allow for the virtual reconstructions to be directly embedded into the page as opposed to externally linked. Our project became centered around its utility to the user. We wanted our database to be easy to navigate and to contain information that the audience would find valuable and useful.
We built Heritage Reconstructed as an open database for a public audience which otherwise may not be able to access these archeological reconstructions. So, at the core of the project, we always envisioned an audience facing some sort of institutional or infrastructural barrier related to education or accessibility. These barriers may be in the form of not having access to higher education, not having access to professional/academic connections in the field, and/or not having access to private databases. This project is one resource that teachers, particularly in the U.S public education system, can use to introduce the topic of 3D/VR archeological reconstructions to their students without having to pay for a subscription to a journal or private database. This is also a resource for students who are exploring topics in virtual reconstruction and archeological perils and simply want somewhere to start.
The work of Heritage Reconstructed, however, goes beyond addressing the need to reach a general audience with accessibility barriers. As we worked on the project, one issue that became very clear was the restricted availability of reconstructions for sites in peril as a classification of sites. It is hard to find a community agenda for sites in peril in the active communities of 3D/VR reconstruction creators. Among the UNESCO In Danger sites that we used to initiate our research process, 53 sites (about 43 archaeological sites and 10 cultural sites such as parks) were classified as in peril and only about 16 archaeological sites had publicly accessible 3D/VR reconstructions. As a result, the people most entrenched in the systems of 3D/VR archeological reconstructions have become a secondary audience for our work — amongst them the VR tech firms, the VR archeological journals, and the museum departments entering the VR reconstruction space. Our goal is to start a larger conversation about the reality of existential perils facing archeological sites and the unavailability of 3D/VR reconstructions of those sites. We envision our project being valuable to these creators as an audience because we are generating a conversation about a topic that directly impacts the work that they do. The crisis of archeological peril cannot be divorced from the objects they work with and as a result must be addressed in future projects.
Project Activities
Initially, our goal was to create a virtual reality database on archaeological sites. The first few classes, we focused on discussing what we meant by archaeological sites; whether we would focus on a particular region or historical period. We realized that we needed to delimit our objects, but it was not until subsequent meetings that we were able to specifically identify the content of our database.
It was illuminating for us when we decided that we would focus on archaeological sites in peril because it gave us a clear understanding of what our project would be and what kind of research we needed to do. The second discussion we had was whether we would focus on a country and/or region of the world, and whether we would focus on a particular historical period. We left this open and it turned out to be a good decision because we identified three patterns in our search of VR. First, there are not many VRs for the sites that UNESCO considers to be in peril. Second, the VRs that are available are created for countries and archaeological sites that come from the same geographical region and are mostly in peril or were destroyed by war and terrorist groups (e.g., Iraq, Libya, Syria, and Afghanistan). Third, the VRs available are created for countries and archaeological sites that are very well known (e.g. Italy and Greece).
The third discussion was whether we would include natural sites in danger (e.g., parks), besides archeological sites or objects in peril. We decided to include only VRs of archeological sites, for example, architecture, art, and/or religious buildings. Once we defined these criteria, the purpose of our VR digital project became clearer for all of us, not only in a practical sense, but rather by giving us a better understanding of the project we wanted to create. After proposing different names for our digital project and further discussion, we were able to finalize the name for our project.
Accomplishments
From the beginning, we knew we wanted to have our database online and openly available to the public. Since our audience is not exclusive to those in academia, we also knew that the information would have to be displayed in a welcoming and easy-to-follow way. The project consists of a Twitter account, Gmail account, GitHub account, website made with HTML and CSS, and an Omeka Database.
Twitter and Gmail Accounts
Once we made a final decision about the name of our project, we started to build an outreach plan. We created a Gmail account, along with a Google Drive folder that everyone in the group had access to. This allowed for a fluid data management system. Whenever a member contributed to the project folder on Google Drive, it was available for any member of the group to review and comment on. As a result, we collectively shared all the milestones of the project whether we directly contributed or not. Google Drive is also an effective task delivery system with the option to assign tasks from Google Docs, send notification emails, etc. In addition to Google Drive, we made ample use of Gmail. We used our Gmail to send emails to a number of academics, introducing our project in the early stages. We also used it to track Google Alerts that we had created for certain keyword terms relevant to our project. These keyword terms included “Heritage Conservation”, “Digital Reconstruction”, “Virtual Reconstruction”, “Sites in Peril”, “Archeological Reconstruction”, etc. We also used our Gmail account to create our social media presence on Twitter. Several times, our Google Alerts brought our attention to articles that we then shared on Twitter. Twitter often served as a place to observe and learn what these communities of creators were doing. At times, we used a number of hashtags to connect our work through a retweet of another 3D/VR creator’s work. Twitter remains a central place to promote our project by allowing users to connect to our database from our page and allowing us to quantitatively measure interactions with our content.
Main Website
Our vision of the website from the beginning included the view of our Twitter feed on the page to keep our visitors engaged with our conversations on social media and up to date with current information. One way to accomplish this was to create our own static pages using HTML and CSS. The HTML and CSS utilized for the website pages, in addition to the HTML used within the database, was learned from Patrick Smyth’s Software Design Lab, and tutorials from W3Schools Online Web Tutorials and WebDevTrick.com for the footer. An additional feature is the loader. The loader is important for cleanly representing the website after everything on the page has been loaded. The pages of the website have a color and font scheme that is meant to replicate the Omeka database.
Once we had our web pages ready, we decided to host them through GitHub Pages using a GitHub account for our project. Github Pages allows us to host our webpages for free with all the freedom and flexibility HTML or CSS allows us. It also allows us to easily add to or update the pages at any time. Since GitHub Pages is also a free to use service, we did not have to worry about costs related to keeping the website up and running. The website can also be available for as long as GitHub Pages is around. GitHub also allows for us to keep track of any changes made to the website over time. Once the website was launched at the GC Digital Showcase, we decided to add Google Analytics to the website so that we can keep track of how many people visit the website. Google Analytics is also a free service used to keep track of visitor traffic.
Omeka Database
When thinking about what we wanted to do for the website, our primary focus was on the database, since it is the main aspect of the project. We started looking into Omeka.net since it is specialized for collections database management. Omeka is used by thousands of institutions and organizations across the US and all over the globe. The Berlin theme is a simple layout that is one of two that are preloaded and makes the content easily accessible. The database focuses on the use of items which are then described by using the Dublin Core Metadata Initiative. Although we are working with images and videos of digital reconstructions, in addition to digital reconstructions themselves, we have been able to showcase all these different types of formats. This aspect, along with the added feature of exhibitions, made Omeka the perfect platform for us. We created a free account with Omeka.net through the Trial plan which allows the unlimited use of one site with 500MB of storage space.
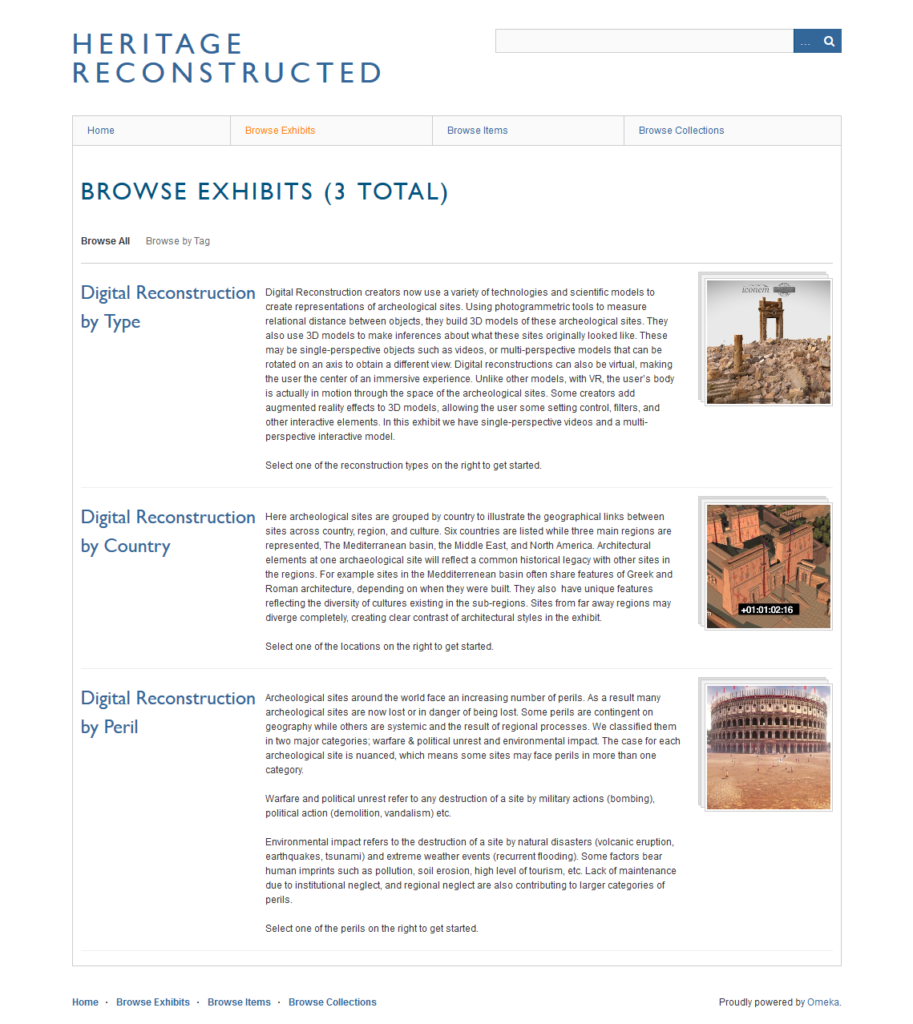
Figure 1. Heritage Reconstructed Database Exhibits Page
Website and Database Overview
To ensure easier readability for individuals who use screen readers, we constructed the HTML to begin with the first item of the menu and when the ‘tab’ button is pressed the item selected to activate goes through each of the items, left to right, before going through the main body of text. The reader is then brought to our embedded Twitter account, which lists the four most recent posts from most recent to older, before being brought through each of the items in the footer from top to bottom and left to right. The pages of the website consist of ‘Home’, ‘Methods’, ‘Mission’, ‘Team’, ‘Resources’, and ‘Database’. The ‘Home’ page has a basic description and background of the project. The ‘Methods’ page describes the data utilized for the database, a description of the website and database, and an embedded map created in Tableau that represents the items in the database. The points can be clicked to be brought to the item in the Omeka Database. The ‘Mission’ page informs of the preservation, accessibility, education, and why the project is important. The ‘Team’ page gives a brief biography of the four team members. The ‘Resources’ page lists links the team has come across throughout the duration of the project. Here, links are broken up by ‘Archaeology Resources’, ‘Other VR Projects’, and ‘Other Similar Projects/Databases’.
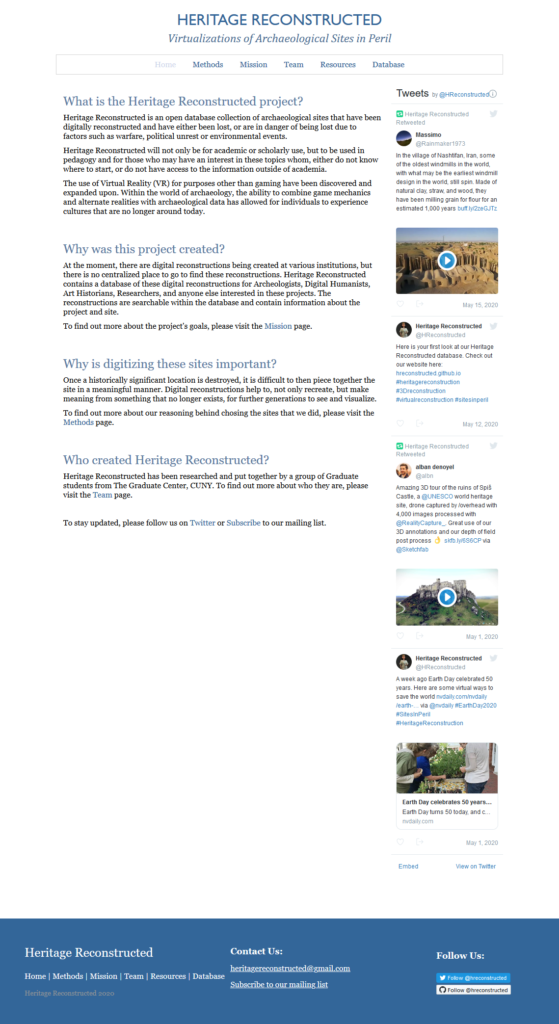
Figure 2. Heritage Reconstructed Webpage Home
The ‘Database’ page directs the viewer to the Omeka database. The database at the moment, contains 11 items. In a similar manner as the webpage, when pressing the ‘tab’ key the item selected within the page runs though the title, menu, description, and footer items from left to right. When initially directed to the database the viewer is first brought to an exhibits page. The exhibits page has three different exhibits and they are broken up by ‘type’, ‘country’, ‘peril’. Each of the exhibits have a description with an image of one of the items in the exhibit. Once the exhibit is clicked on a page with the title, description, and list of the types within the exhibit. For each of the items in the database a Dublin Core schema is utilized which includes title, subject, description, creator, publisher, date, rights, format, language, type, identifier, coverage, URL, files, and tags.
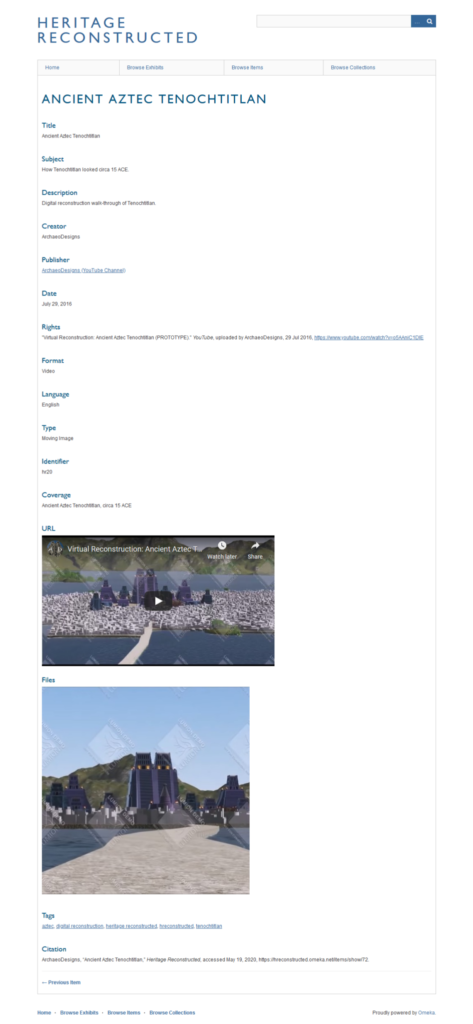
Figure 3. Heritage Reconstructed Example Item Page: Item displayed is titled “Ancient Aztec Tenochtitlan”
Evaluation
Narrowing Scope
At first, we wanted to include any virtual reconstructions that were available online for any archaeological sites. This, however, was difficult to search for, not because there is too much out there, but because there is not enough that is publicly available. Through discussions with Professor Maney, he suggested that we think of a focus for the database by searching for certain archaeological sites, focusing on the question “besides just being virtual reconstructions of archaeological sites, why are these reconstructions important?” After this discussion, we came across the UNESCO In Danger list and the Open Heritage 3D project, which included some sites that a few group members recognized as having virtual reconstructions created already. This led to the focus on sites that had either been destroyed already or are in peril. Since there are not many virtual reconstructions publically available to begin with, we decided to shift the focus to, not only housing the reconstructions, but having the project act as a platform to discuss the importance of creating virtual reconstructions for archaeological sites in peril. By using the UNESCO In Danger list, we were able to see if any or all of the sites on the list had virtual reconstructions.
Representing our Data
When first presenting our website and database to our peers and a Digital Fellow at the Graduate Center, Micki Kaufman, she suggested that we include an interactive map that shows the different sites in order to have a visual representation of the sites in our database. Using this suggestion, we created a map in Tableau that maps the location of each item in our database. We embedded this map on the ‘Methods’ page of our website. As we continue to add more sites to the database, and thus the map, we will look into putting the map on to its own page, as was suggested by Professor Maney.
Another suggestion provided by Professor Maney was to create a landing page when a visitor goes to the database. Although the database is linked through the website, there is a possibility that someone will either find the database on its own (if through a web search) or if they click to the database without reading about our project first on the website. In order to mitigate any confusion that may arise when going straight to the database, we decided to utilize the exhibits feature that Omeka has to create three exhibits that lays out all of our items by type of reconstruction, type of peril and country. This allows a way for any visitor to be guided through the database and have a basic understanding of what the database is about.
Website Traffic
One suggestion that arose at the GC Digital Showcase was the idea of keeping track of visitors to the website. Since GitHub Pages only hosts our code for the website, it does not allow for the option of keeping track of visitors to the website. In this case, we decided to use Google Analytics as a way to track visitors since we already had a Google account for the project and the service was free. All we had to do was add some code at the top of all of the pages of the website. It is unfortunate that we did not think of this sooner to be able to keep track of all visitors from earlier in the project’s creation. This could have helped us when it came to our social media outreach. We could have seen what actions were successful in bringing people to our website, which, in turn, could have altered the way we reached out to people. In addition, we were only able to add Google Analytics to the website and not the database itself. Although Omeka allows for a Google Analytics plug-in, this is only available for paid plans.
Future of the Project/Sustainability
Social Media and Outreach
Although we have some ideas about the audience we hope interacts with our projects, pinpointing that audience in the online universe has been a harder feat. We will continue our efforts (including the use of social media) to give audiences a chance to discover our project. In the meantime we are reaching out to the professional connections, mostly CUNY professors in the archeological departments at several campuses, who already have a built-in audience whom we think will find this project useful.
One of the unique things about Heritage Reconstructed is that it straddles the spheres of virtual reality, archeological conservation and is intended as a pedagogical tool. These learning communities are unlikely to overlap in digital working groups even though their work perfectly intersects in a project like Heritage Reconstructed. Our long term goal is to promote interdisciplinary exchange in digital working groups for much needed projects like Heritage Reconstructed. We also want to keep the project running for as long as possible after we wrap up the spring semester. We want to continue to engage these divergent communities by updating our database regularly with new developments in VR/3D reconstructions for sites in peril. We will continue to create awareness on the topics of preservation and accessibility through our published content and social media interactions.
We hope that with continued interdisciplinary explorations of VR technologies in traditional fields like archeology, more people will create more publicly accessible resources for pedagogy. We also hope that Heritage Reconstructed will provoke a higher percentage of the 3D/VR creator community to start exploring the classification of sites in peril as a primary subject. The existential perils facing archeological sites presents an opportunity for collaboration among 3D/VR creators and heritage conservators to really dig into the disparities that have surfaced in the availability of 3D/VR reconstructions for those sites, as well as the limited regional scope of what’s available. That is something that future 3D/VR reconstruction creators must address.
Journal Publication
We are planning to write an article on the use of our virtual reconstruction database in classrooms, either through assignments or during class time. With the shift from in-person classes to online classes, students need online resources now more than before. We aim to reflect in the article on some issues related to digital pedagogy, and at a more practical level, on what kinds of projects students can develop with our database, with the aim of enhancing their historical, cultural but also their digital skills. Initially, the journal we have in mind is the Journal of Interactive Technology and Pedagogy.
Website and Database
Although the semester is over, the database will continue to be updated. Once a new site has been recognized, it will be entered manually or, if there are many to add, a CSV can be utilized to import them en masse. Once the sites are added to the group’s Omeka database as an item, they will then be grouped in each of the three exhibits for the database.The site or sites will then be added to the map portion of the project which will in turn connect back to the database. There will be a WARC file of the Omeka database at the time of course completion and added to the group’s GitHub repository.
The Tableau map is up to date and will continue to be updated. The profile currently used is Christofer’s Tableau Public account. For as long as there is access to this software, the map will continue to be added to. If access to Tableau becomes disconnected, another mapping source will be used. Other software platforms that could be used are ArcGIS or QGIS. The Tableau map of Heritage Reconstructed sites will be made into a WARC file at time of course completion and added to the group’s GitHub repository.
Although the website page will be kept the same for the most part, it will be updated if and when needed. The group will work to ensure account accessibility to Heritage Reconstructed’s GitHub repository so that the project website will be kept ‘live’ for the next few years so all users can still openly navigate to the group’s site. A WARC file of the website pages will be made of all pages at time of course completion and added to the group’s GitHub repository.
Works Cited
Google Arts & Culture. (n.d.). Open Heritage. https://artsandculture.google.com/project/cyark
Learning Sites Inc. (2020, April 27). Welcome to Learning Sites Inc. http://www.learningsites.com/
Open Heritage 3D. (n.d.). https://openheritage3d.org/
Project Collart-Palmyre. (n.d.). http://wp.unil.ch/collart-palmyre/
Refsnes Data. (n.d.). W3Schools Online Web Tutorials. https://www.w3schools.com/
Shaan. (2019, May 17). HTML CSS Footer With Responsive Design | Fixed Bottom Footer. WebDevTrick.com. https://webdevtrick.com/html-css-footer/
UNESCO World Heritage Center. (n.d.). World Heritage in Danger. http://whc.unesco.org/en/158/
Heritage Reconstructed Website Link: https://hreconstructed.github.io/

This entry is licensed under a Creative Commons Attribution-NonCommercial 4.0 International license.