Category Archives: Group Project Updates

Final Newbery Group Update 4/29

The team has focused the last week on data collection and creating content, while reviewing our project plan and deliverables. In regards to our data, the Caldecotts are (for the most part) completed, data is being cleaned, and our existing visualizations are getting an upgrade. In our meeting, Emily and I reported on the Caldecott data and how essential the YouTube read alongs were when examining protagonists. While speaking with Meg and Kelly, we realized that we did not include gender for the animals and nonhuman protagonists (where available) and are going to work on filling that in before the 12th. For example, in Olvia by Ian Falconer, Olivia is a female pig. We originally labelled Olivia as just an animal, but we will now include gender. Authors will often assign gender to their animal and nonhuman protagonists, and it should be included in our analysis. During our meeting, Meg brought up an excellent point about how we are reporting gender in our data, and we had a tough but important discussion regarding our practices as well as our audience. I recommend everyone read Meg’s blog post for more information on the topic and our discussion: https://whowins.commons.gc.cuny.edu/2020/04/26/our-data-in-and-beyond-the-gender-binary/

While Kelly was waiting for the Caldecotts, she worked on the Newbery visualizations in Tableau. She changed the view to Story, making it easier for our audience to navigate through the visualizations. Kelly was also put in contact with a woman who has experience with Tableau. She shared tips and best practices, which Kelly will use with the Newbery and Caldecott data. 

With Kelly working on the visualizations, Meg, Emily, and I will work on completing blog posts for the website. Topics include the U.S. Census, how our research methods have changed due to covid-19, and other Book Awards that many parents and educators are unaware of. We will also continue to create content for Twitter, and participate in Day of DH 2020. We are focusing on Twitter to build interest for our project and share our methods, and will use our Instagram account to share our visualizations and graphics. Before the presentation on the 12th, we will review the website for any broken links and missing pages, and will do a final run through once we embed the visualizations on our site. We want to make sure that our visualizations will display properly and that our audience can successfully interact with them.

We are looking forward to the dress rehearsal next week and then launching our project at the GC Digital Showcase. I know that this has been a challenging semester for all of us, but I am proud of both my team and the Heritage Reconstruction team for what we have accomplished. 


Newbery Update 4/22

Stage Two: March 20th-April 19th:

  • Content Development: Complete the Google Spreadsheet for Caldecott Books. Tweak Tableau Interface, create visualizations; Start blogging on the Website.
  • Design: Finalize website design and add pages to the site (Caldecott, etc.)
  • Outreach & Publicity: Continue to RT content on diverse books/child literacy. 

Reviewing our Project Work Plan, we have hit most of our milestones. During the last two weeks, we focused on creating content for our social media accounts and blog. We also finalized our website design, and have added most of the pages. Regarding our data, we created Newbery visualizations and are sharing them for our next round of feedback.

We were delayed with the Caldecott data, specifically with the breakdown of protagonists, due to the shutdown. We had to get creative, finding read-alongs on YouTube and reaching out to scholars who published Caldecott articles and asking them to share some of their data. The read-alongs were very helpful when dealing with the older Caldecotts, and the scholars were happy to share parts of their work. We will finish the Caldecott Spreadsheet by the end of this week, and then will start playing with the data in Tableau. We are also ready to share some visualizations on our social media, with links to the website.

As we enter the final stage of the project, we are re-thinking our deliverables. In our initial project plan, we wanted to create printable visuals and infographics that librarians and educators could place in their libraries and classrooms. Since classes will be taught virtually for the rest of the school year, we will focus on visualizations that can be shared with our audience digitally. We will also write a blog discussing how covid-19 impacted our research and outreach plans for this project.

The weeks leading up to the presentation will be busy for us. Over the next week we will finish collecting the Caldecott data and start creating vizzes, as well as post more original content on our blog and social media pages. 

Heritage Reconstruction Group Update

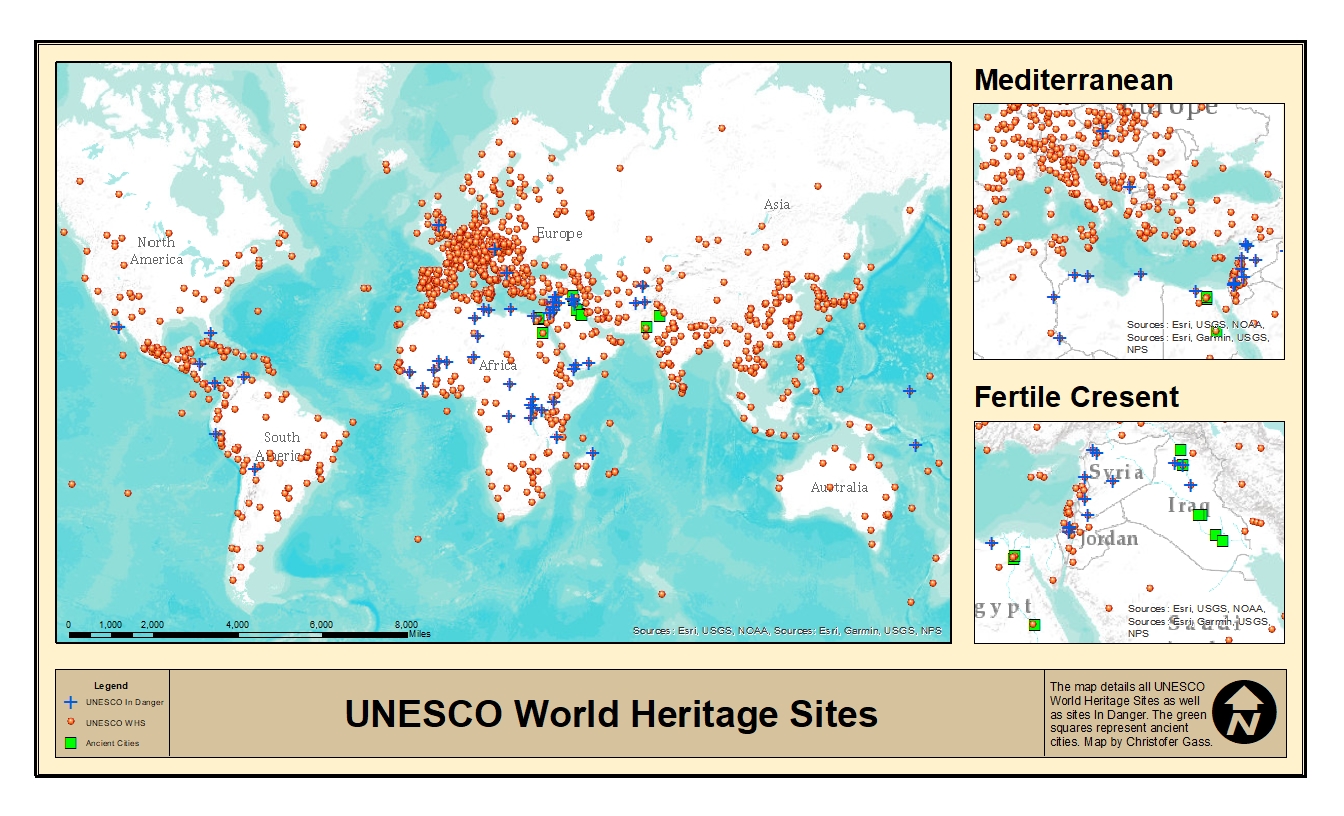
Over the past two weeks, Heritage Reconstruction has thought about the questions that arose from our mock presentation. We have made edits to our database, created a map in ArcMap to start a springboard of conversation for a mapping aspect for our project, and continued to update our Twitter feed. Brett brought up a great point about the pros and cons of a digital map vs. more sites. As of right now, we are leaning towards a little of both. I provided a basic run-through of how to import a CSV to Omeka with the rest of the group after our class meeting and Marcela is determined to add another site before Thursday. We added one last night during the demo, but it is still ‘private’ and needs to be further updated. So, we are approaching the teens of objects in our database. The static map that was created will be revised and converted to Tableau to provide information within the tooltips. A wonderful point Marcela made was to make the Tableau tooltips direct the viewer to the object within our Omeka database, which seems manageable as a hyperlink. We are very excited about the last two weeks of hard work before our presentations in early May. Also, our webpage is continuously updated by our wonderful Twitter feed. While on the site, I am always captivated by the most recent tweet.
gass_unseco_map_2020


Newbery Group Update 4/8

Following last week’s meetings and update, the team has spent their time working on the Caldecott data, Newbery vizzes, and our social media and outreach. We are almost done collecting the author and illustrator data and when complete, we will begin working on the protagonists. Emily and Georgette will search for the protagonists’ gender, race, and ethnicity. Once the Caldecott data is collected, Kelly will begin working with the data in Tableau. In the meantime, Kelly met with GC Digital Fellow Rafael Portela, and they reviewed the Python code Kelly created to scrape the Caldecott awardees. 

Regarding social media and outreach, we found more accounts to follow on Twitter and Instagram, and started creating original content. We were already following several DH programs and Newbery authors, so we added Caldecott authors/illustrators and related diversity projects and organizations. People of Color in Publishing (@PocPub), Latinx in Publishing (@LatinxinPub), Books for Kids Organization (@booksforkidsorg), and the Children’s Book Council (@CBCBook), just to name a few. We hope that when we share our vizzes, they will offer helpful feedback and promote our project when it is finished. This week we will continue to work on the following: 

Meg: I am going to write two 500 word blogs and automate postings to our social media accounts, including posting visualizations to Instagram. 

Emily: I will continue working on the Caldecott data, finishing up author/illustrator and then moving on to protagonists. I am planning on double-checking the data I collected with the articles Georgette found. I will be on the lookout for interesting content for our Twitter and Instagram pages.

Kelly: I got help from Rafa to understand how the Caldecott Python scrapes could have been more effective-something that will be great to play with if we continue the project beyond the scope of the course. I also continued to clean the data for the Newberys, as we now need outside feedback.

Finally, I played unsuccessfully so far with displaying the data counter-factually, as removing white people didn’t do much since there are some early authors and protagonists of color. But, I plan to play with grouping by decade and non-Census lenses as I have the next two days off. 

Georgette: I am finishing up collecting my portion of the author/illustrator Caldecott data, and will then move on to the protagonists. I will use the articles I found to double check my work on early honorees. 


Newbery Group Update

During our group meeting, the team discussed how some areas of our project need attention. We realized that with the expansion of our project, we put some tasks on the back burner, and will use the next two weeks to work on them. One area we will work on is outreach, particularly our social media accounts. After seeing how effective Heritage Reconstructed was with their Twitter account, we realized that we were hesitating to fully dive in and limiting our reach. Although we are not yet ready to share our visualizations with the public, we do need to build an audience that knows what our project is about, and is eager to see our work. With that in mind, we will continue sharing content from authors, libraries and similar projects but will also work on engaging our audience with original content. We can have discussions about their children’s favorite books as well as theirs from when they were kids, or who is their favorite children’s author now. We will also blog about the project itself, our recommendations for diverse books, and special features.  

Since we expanded the project, we need to update our website to include the history of the Caldecott, and remember to create connected content on social media. During this week, we are collecting identity information on the 345 Caldecott books. Once this task is complete, Kelly will begin to work with the data on Tableau. In the meantime, Kelly is working with the Newbery visualizations and they will soon be sent out for initial feedback from our test audience: librarians, educators, and representatives from similar projects. We’ll take some of Micki’s suggestions too, to consider how to share the data through different racial and ethnic lenses other than the census categories, which may be (fingers crossed) doable through a few if-then statements in Tableau. As we play, we’ll keep our audience in mind, trying hard to make sure that the visualizations we ultimately still stay in service to our audience of librarians, educators, and parents.

Our plan for the next two weeks: 

Emily: This week I will continue to work on the Caldecott data, working on author/illustrator and then moving onto protagonists. I will also look into helping with social media, whether that be looking for content on Instagram/Twitter that we can then reshare. I will continue to make updates to the website. Throughout these next two weeks, I will check in with the team to see if anyone will need some extra help too!

Georgette: Continue working on the Caldecott data, as well as creating new content for Twitter as mentioned above. I will also reconnect with my contacts from the Diverse Book Finder and Cooperative Children’s Book Center and ask if they would consider being part of our test audience for the Newbery visualizations. 

Kelly: Updating and playing with the Newbery visualizations. Seeking feedback from parents, Steve Zweibel, and Meg’s contact at the NYPL. Meeting with whatever GCDI fellow responds to her request for a meeting about why the python scrapes have sometimes gone flawlessly and other times not.

Meg: I will write two 500 word blogs and post over the next two weeks. I will also work on learning social media and set up a schedule for posting content. 

Heritage Reconstructed Group Update

At Heritage Reconstructed we are now solidly in the implementation stage of our project. We now have a static landing page that our project developers continue to build on every week. By building our own static page separately from the database hosted by Omeka.net, our team has been able to experiment with using HTML to build pages from scratch. This week especially, other members of our team who are not developers have been able to participate in those HTML discussions and learn from our developers now that we have the pages up to walk through.

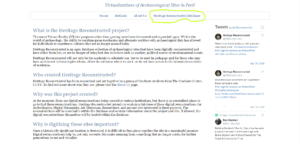
Our team has done a good job creating links between different parts of our project. As you can see in the picture below, when you access our landing page, you can see our twitter feed on the right side of the page updating every time a new post is made. Then at the top of the page you can access a link to the database.

screencap of Heritage Reconstructed landing page

The focus of this week was primarily to get some of our archeological sites up to the database therefore a lot of our efforts were concentrated on evaluating the data for the sites in peril and also finding the right presentation format for the database itself. In response to the data we gathered, we made the choice to limit our selection to archeological sites and made the distinction from natural sites in peril. As Marcela explained in last week’s update, a number of the 53 sites in peril as classified by UNESCO World Heritage do not currently have digital reconstructions. If they do have them, they are not publicly accessible. The lack of virtual reconstructions in our category of interest was always a question lingering over our project. What if we couldn’t get access to the data we needed? While we always posed these questions  to our team and understood the challenges of gathering this data, this week has really pushed our research in evaluating the sites we do have, especially in setting the criteria for what it means to be in peril.  Initially we focused on war, political unrest and environmental factors, however  heavily trafficked tourism is now also considered a peril.

There are many moving parts to building the database. On the back end, our team continues to work on the Omeka.net developer interface to build the layout of the database. Since we didn’t have to build it from scratch, we used certain features available through Omeka such as the theme and the Dublin core. We discussed the best ways to display the items such as YouTube Videos and 3D reconstructions in Omeka. Once we figured out the best way to do so, we started a csv spreadsheet for the data objects and text that we import directly into Omeka.

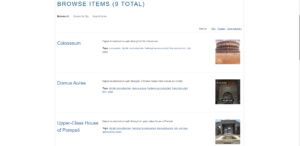
We has recently uploaded our first batch of 9 archeological sites into the database. We started with many of the well-know archeological sites such as the Roman Colosseum and the Second Temple of Jerusalem but will expand into other lesser known sites in peril. In terms of the presentation, users can easily navigate through each archeological reconstruction by clicking on the name and opening a separate page containing all the tags and descriptive details about the site as well as the embedded or linked digital reconstruction. As we go through the data, we will be putting up more and more sites and improving where we can on the user experience.

screencap of heritage Reconstructed database

So far we have remained on schedule with our tasks thanks to our constant check-ins. From the beginning we established a good system of task delivery and communication through basecamp and google drive. One thing we’re thinking about, as Micki suggested is to find a way to visualized what is absent in terms of the sites in peril that do not have digital reconstructions.


Newbery Group Update

In our group meeting, we reported our progress on our individual tasks, as well as the work that needed to be done due to our expansion of the project.

  • The team is very happy with the overall design of the website. Emily reviewed the suggested sites and recommended we create additional pages, including pages for our visualizations and infographics.
  • Meg wrote our first blog post and will post it on the website by the end of this week. We discussed possible content for future blogs and how often we should post. Besides recommending books, we will write project updates and in-depth features. For example, a post examining how African Americans were portrayed in the Caldecott books with selected illustrations. Meg will handle blogging, although any team member can contribute.
  • We discussed the importance of a strong social media presence for our project. So many award authors and organizations are using social media right now, which makes this is the perfect time for us to connect with them and raise awareness of our project. Meg will handle our social media accounts.
  • Kelly provided an overview of the Caldecott data that she scraped and cleaned. The data suggests that there are earlier instances of diversity (in contributors and subject matter) in the Caldecott books as compared to the Newbery books. Also, several illustrators were honored multiple times so collecting identity information will be quicker than with the Newbery authors. We will follow the guidelines we set for the Newbery data when finding identity information for the Caldecott.
  • I discussed how my search for historical data on children’s publishing is faring. Besides the statistics from the CCBC, I found articles from 1965 and 1985 that includes data about African Americans in children’s books. The data from the 1965 article seems to be flawed, because the questionnaire asked for books including African Americans instead of about African Americans. For example, a biography on Abraham Lincoln was counted as a book including African Americans since Lincoln issued the Emancipation Proclamation. The data from the CCBC however is books about African Americans. I will continue my search for data, but the 1965 article could be useful for inclusion in a blog post.

This week the team will focus on the following:

Emily and I will collect Caldecott author and illustrator identity information. Kelly will go back to working on the Newbery visualizations, which we will eventually send out for feedback. Meg will create the slides for the class presentation next week and post content on our social media accounts.

HR Update

Considering everything that is going on, Heritage Reconstructed has had a productive two weeks. Our site is live! Head on over to https://hreconstructed.github.io/ to check us out. In addition to our website, we are proud of the accounts we have for our project, so far. We are on Gmail – heritagereconstructed@gmail.com, Omeka – https://hreconstructed.omeka.net/, GitHub – https://github.com/hreconstructed, and of course our most public media, Twitter – @HReconstructed. I love our name, and we took hours of discussion and debate on coming up with it together, and the transition to hreconstructed is totally logical. However, that was a side effect that we didn’t necessarily consider initially and due to this, there is not 100% continuity throughout our media names. My initial thought when I noticed this was, “let’s just change our email address to hreconstructed@gmail,” but we have already started outreach. So, that would possibly be counterproductive.

The website is a conglomeration of Ashley and I’s efforts, and we, and the team, are proud of it. The site went through a couple of editions before it became the site that is live today, and through that process, Ashley and I learned, as well as, tightened our HTML/CSS skills. We were also forced to home in on what we wanted to get out of it for the project, which we are for the most part done with.

The website is written in HTML and CSS with a link to our Omeka database. We initially, included the CSS for the page within the HTML code of each of the pages, but this became daunting to change repeatedly for all the pages. So, the CSS was broken into its own page. A major reason for the CSS to have its own page was the lengthy code for our footer.

The pages of the website have a color and font scheme that is meant to replicate that of Omeka’s database. Which is the main portion of our project, with the website acting as a landing page for details of our project. There are plugins for making pages in Omeka, but we are both past and current students of Patrick Smyth. So, to push our knowledge that began in Software Design Lab is a sensible move for us. At times, its been difficult to get parts of the page to work when they would be simply rendered on a pre-built website, but having to work out the code is not only rewarding, it is able to give our page a setting that is one of a kind.

In addition to code learned through Software Design Lab, we utilized https://www.w3schools.com/ and https://webdevtrick.com for the footer. An issue we were having with the footer was that it was not responsive. The menu and body of our pages shifted when the webpage minimalized, but the footer we were initially utilizing did not. When the page is minimalized, the menu starts to stack on top of each other and our Twitter blog on the right side of our page drops below the text of the page. We looked for a footer that did the same and were impressed with the footer by https://webdevtrick.com/. Now the three panels of our footer become a list when the page is collapsed to a certain width.

For the rest of this week, we are working on a draft email that will be sent out for outreach and working on our Omeka database – which we are very excited about.

Newbery Group Update

Stage One (2/19-3/19)

  • Planning & Research: Research proper race/ethnic terms for protagonist. Research critical race theory and find articles on Newbery Awards and diversity in children’s literature.
  • Content Development: Complete the Google Spreadsheet of Author Breakdown. Complete the Google Spreadsheet for Protagonist Breakdown
  • Design: Sketch up outline of website: each page (Home, About, Methods, Data) using WordPress through Commons. Future Page Suggestions: Social Media, Suggested Reading, and Infographic.
  • Outreach & Publicity: Set up social media accounts for the project. RT news on diverse books (and other suggestions). Create an email address.

Referring to our Project Work Plan, we have met our milestones in Stage One. We researched critical race theory, overall diversity in children’s books, and found articles discussing the Newbery Awards. We completed the Author and Protagonist Breakdown of Newbery Medal and Honor Winners and are creating initial visualizations. We drafted a website and created social media accounts and an email address for outreach. (Instagram & Twitter: whowinswithbookawards; gmail: newbookaward@gmail.com.)

Since we are ahead of schedule, the team decided to expand the project to include Caldecott Medal and Honor Books in our analysis. We will finish collecting the data by next week, and will have visualizations for both Awards by the end of Stage Two (March 20-April 19).

Our primary focus this week is to scrape the remaining Caldecott data and manually collect author and protagonist identity information. We also hope to get a set of visualizations together that we feel are ready for outside feedback. We recognize that current global circumstances may slow the feedback process, so having the Caldecott data to play with will give us good purpose as we wait.

We will also post our first blog and create social media content promoting diverse award books parents can read with their children-thanks Bret for the suggestion. Regarding the website, we are researching accessibility and will make any changes necessary before asking others for feedback. This week we will look at the website examples Bret sent to determine if there are any additional pages or layouts we want to include.

HERITAGE RECONSTRUCTED: OUTREACH PLAN

Audience

The key to our social media strategy was identifying our primary audience. We are building a database to hold VR and digital reconstructions of sites and structures in peril. We knew that our topic was micro-targeting a very important issue where the primary audience was limited to people who already work in VR and digital reconstruction as well as people who are actively concerned about the environmental threat to archeological and natural structures. So the initial step of our outreach efforts was simply to find the online community where these groups of people engaged with one another. The most widely used platform for this type of  public academic engagement was twitter. So we created an email to register for a twitter account. The email will also serve inquiries and subscriptions from our website. This allowed us to discover a lot about the communities that will be the primary audience for our project and to think ahead about which institutional need our project fulfills in those spaces.

Social media strategy 

Our social media strategy is to engage with the 3D and Virtual reconstruction community and the environmental conversation community of scholars already on twitter by interacting with their work through likes, retweets and comments on a regular weekly basis. We want to make sure we are on top of news, discussions, and breakthroughs where a lot of conversation is being generated. We also generate conversation through new posts and add minor comments based on new articles that come into our inbox from the google alerts we set up. We regularly update our audience on our project. We also make strategic use of hashtags to bring people in the search tags to our page. We will also create a small marketing blurb to post about our projects on relevant facebook groups that will identify as the project nears completion.


Email strategy

Our email strategy is to organize a list of email addresses of public digital scholars and people working in the field of our projects into a sizable list.  We will gather these email addresses from academic communities that we have access to as well as public Linkedin and Twitter profiles. By the end of this week, we will have a draft email introducing our project that we will share with these members.We will have an automatic response email that links inquirers to our social media page where we update our project’s milestones.

Communication and Website

People will be able to reach out to us directly on twitter where our email address is listed and through our website where there will be a contact page that allows the public to ask questions and submit other requests. Our Website will also contain an about page that introduces our team members and gives specific details about the goal of our project. In addition our twitter feed will appear on the side of our site to allow people to follow us on twitter after they visit our site. The public will also be able to subscribe to our site to receive email updating them about the project.

We will also create a promotional  flyer with relevant information about our project to attach to email or give out in person.

Search Engine Optimization

A technical aspect of our outreach is to optimize pages of our website for google’s ranking algorithm. I’ve previously worked with SEO when I did marketing for a jewelry company and I helped place close to 7000 pieces of jewelry online. Although I used proprietary software to optimize our pages. I think it is worth trying to play with the algorithm in hopes of reaching a secondary audience. It certainly can’t hurt to try. Backlinks are proven to be one of the most effective ways of increasing google ranking, other than keyword optimization. Part of our strategy must be finding scholars who may be willing to link to our website from their blogs and other online public accounts (facebook/twitter)