
As our group continues to do its research, a data story is emerging: children’s book awards can be beneficial, providing exposure and longer shelf life to quality books, but with that power, they can neglect important voices and provide longer shelf life to societal inequality. This week, I focused on how we might start to tell that story of our data through visualizations.
Two weeks ago, I created a set of four waffle charts about the Newbery Awards that statically celebrate* one extreme (the number of female authors at nearly 70%!) while exposing the shocking other extreme (that less than 10% of authors were people of color). So, this week’s task was to think about what our audience would want to see next. Perhaps they might want to dive into why female authorship is so high. Has authoring children’s books been considered largely a motherly, and therefore gendered, office? Have societal roles provided women more experience selecting and reading children’s books, thereby giving them an edge and a path into the market? Were selection committees more female than male? If female authorship is so high, why are protagonists only 30% female? All of the questions seemed interesting, and I did some research to see if there may be a compelling reason to find and present data to answer them.
The research was pretty fascinating. Perhaps my favorite find was that the selection committees seem to have been exclusively female until 1964, when Spencer G. Shaw, an African-American male librarian, entered the scene and continued to sit on the committee for four years. He seems to have opened up the committee to male participation, though that body of deciders remained largely female, even up to 2020.
Another highlight of my research was a 2011 study from Florida State University focused on a far broader selection of children’s books published throughout the 20th century. Its findings confirmed that the Newbery awardees, at least in terms of the gender of the protagonists, mirrored larger children’s book publishing trends as well as trends among other media, such as cartoons. Among the study’s many interesting finds, a news summary about the study shares that “males are central characters in 57 percent of children’s books published per year, while only 31 percent have female central characters”—nearly the same ratio in Newbery Awards. The study itself also affirmed the purpose of our investigation, noting: “Adults also play important roles as they select books for their own children and make purchasing decisions for schools and libraries…Therefore combating the patterns we found with ‘feminist stories’ requires parents’ conscious efforts. While some parents do this, most do not” (219).
But, since women already comprised the majority of authors and female protagonists were at 30%, I thought the racial disparity might be the more important next step. More than questions about gender, I thought readers might be eager to understand more deeply the startling statistic about authors of color.
I assumed that the first question on our users’ minds might be whether authorship has gotten more diverse over time, so I created a visualization to answer that question. I included a filter so that our users could determine if there was more author diversity in the Honors, as opposed to the Medals themselves, and I added information in the tool tip to help users identify quickly the specific books and authors represented by each data point—hopefully to promote the books by authors of color. Those tool tips also offer additional race/ethnicity data beyond what the US census categories allow, hopefully shedding light on both the oddity of the census categories and a tiny bit of diversity within the white authors themselves (as some white authors are Jewish or come from recently immigrated families from European countries). What I think is most effective about the chart is how clearly it illustrates that the Civil Rights era changed the scene. Only two authors of color appear prior to 1969—Indian-American author Dhan Gopal Mukerji and African American author Arna Bontemps. From 1969 on, the picture is rosier for black authors (moreso than any other group of color), but the awards remain clearly and heavily skewed toward white writers. As Georgette put it during our feedback session, there’s practically a solid line of white authorship throughout the history of the awards.
For contrast, I created a graph of protagonists’ races over time—a very different constellation of data points, and one that begs the question of who has been given license to write about whom over time. Here’s how it looks right now:
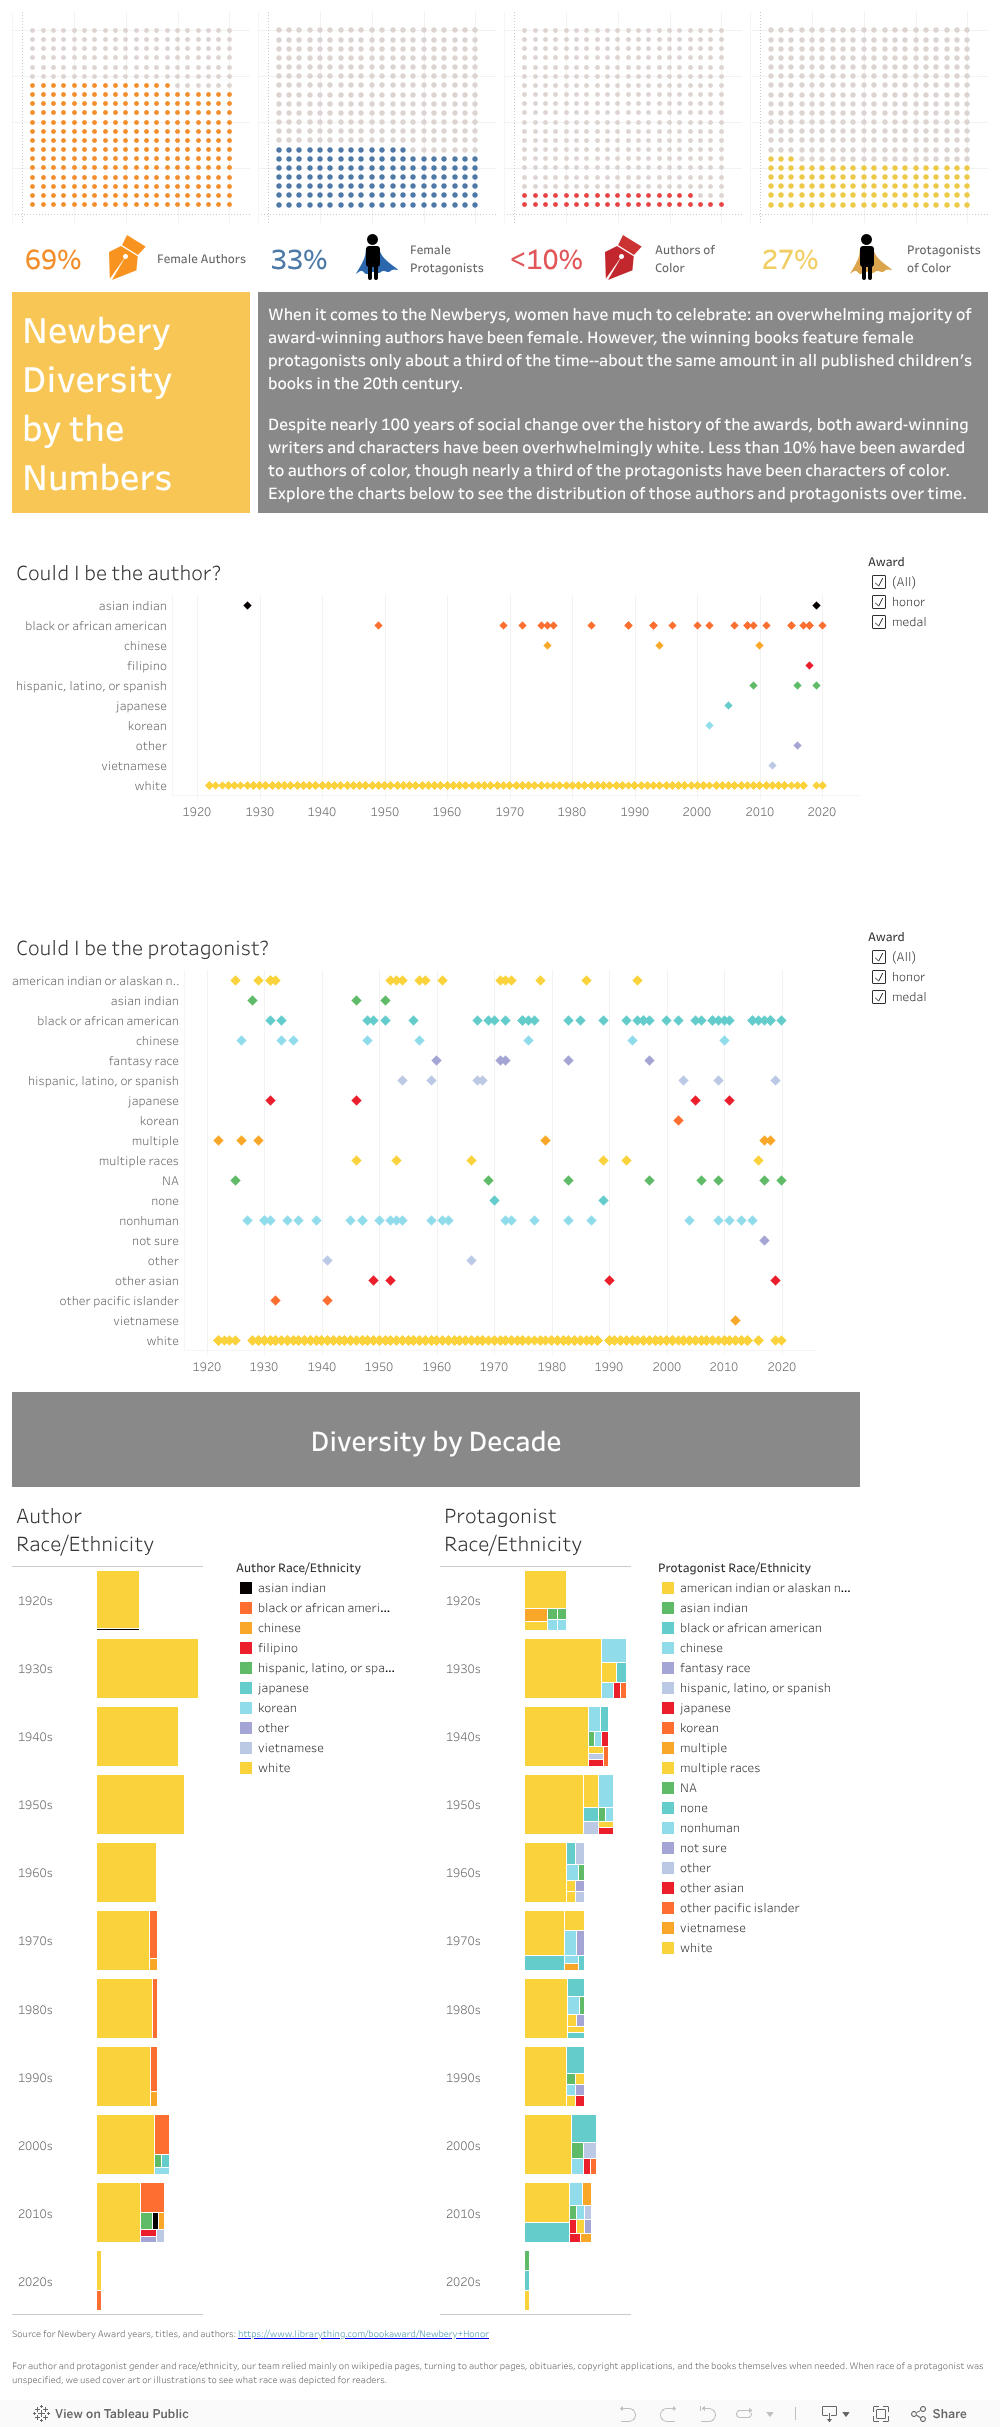
(Or, explore it on Tableau Public.)
Tonight, my group provided helpful feedback, and, after I make some changes, we’ll start to get outside critiques this week. I’m eager to make sure that the choices we make are those that benefit our users—choices that help them decide how to let these awards inform their own selections as they pick books for their collections, students, and kids.
*While such a majority might not feel like cause to celebrate—after all, wouldn’t it be great if a fuller spectrum of gender was represented and if author gender mimicked, proportionally, society?—the Newberys were created only two years after women received the right to vote. So, we celebrate that the awards seemed to be a consistent and viable place of recognition for women in a century that was far less equitable to them. (Interestingly, the FSU study does note that the percent of female protagonists is slightly higher during years of greater awareness of women’s issues on the national political stage.)

This entry is licensed under a Creative Commons Attribution-NonCommercial 4.0 International license.