At Heritage Reconstructed we are now solidly in the implementation stage of our project. We now have a static landing page that our project developers continue to build on every week. By building our own static page separately from the database hosted by Omeka.net, our team has been able to experiment with using HTML to build pages from scratch. This week especially, other members of our team who are not developers have been able to participate in those HTML discussions and learn from our developers now that we have the pages up to walk through.
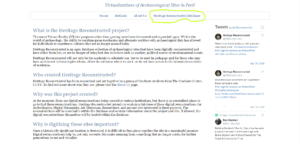
Our team has done a good job creating links between different parts of our project. As you can see in the picture below, when you access our landing page, you can see our twitter feed on the right side of the page updating every time a new post is made. Then at the top of the page you can access a link to the database.

screencap of Heritage Reconstructed landing page
The focus of this week was primarily to get some of our archeological sites up to the database therefore a lot of our efforts were concentrated on evaluating the data for the sites in peril and also finding the right presentation format for the database itself. In response to the data we gathered, we made the choice to limit our selection to archeological sites and made the distinction from natural sites in peril. As Marcela explained in last week’s update, a number of the 53 sites in peril as classified by UNESCO World Heritage do not currently have digital reconstructions. If they do have them, they are not publicly accessible. The lack of virtual reconstructions in our category of interest was always a question lingering over our project. What if we couldn’t get access to the data we needed? While we always posed these questions to our team and understood the challenges of gathering this data, this week has really pushed our research in evaluating the sites we do have, especially in setting the criteria for what it means to be in peril. Initially we focused on war, political unrest and environmental factors, however heavily trafficked tourism is now also considered a peril.
There are many moving parts to building the database. On the back end, our team continues to work on the Omeka.net developer interface to build the layout of the database. Since we didn’t have to build it from scratch, we used certain features available through Omeka such as the theme and the Dublin core. We discussed the best ways to display the items such as YouTube Videos and 3D reconstructions in Omeka. Once we figured out the best way to do so, we started a csv spreadsheet for the data objects and text that we import directly into Omeka.
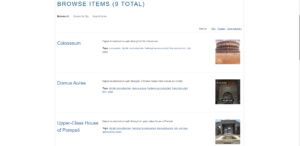
We has recently uploaded our first batch of 9 archeological sites into the database. We started with many of the well-know archeological sites such as the Roman Colosseum and the Second Temple of Jerusalem but will expand into other lesser known sites in peril. In terms of the presentation, users can easily navigate through each archeological reconstruction by clicking on the name and opening a separate page containing all the tags and descriptive details about the site as well as the embedded or linked digital reconstruction. As we go through the data, we will be putting up more and more sites and improving where we can on the user experience.

screencap of heritage Reconstructed database
So far we have remained on schedule with our tasks thanks to our constant check-ins. From the beginning we established a good system of task delivery and communication through basecamp and google drive. One thing we’re thinking about, as Micki suggested is to find a way to visualized what is absent in terms of the sites in peril that do not have digital reconstructions.


