Kelly’s Reflection: Week of 3/30 – 4/5

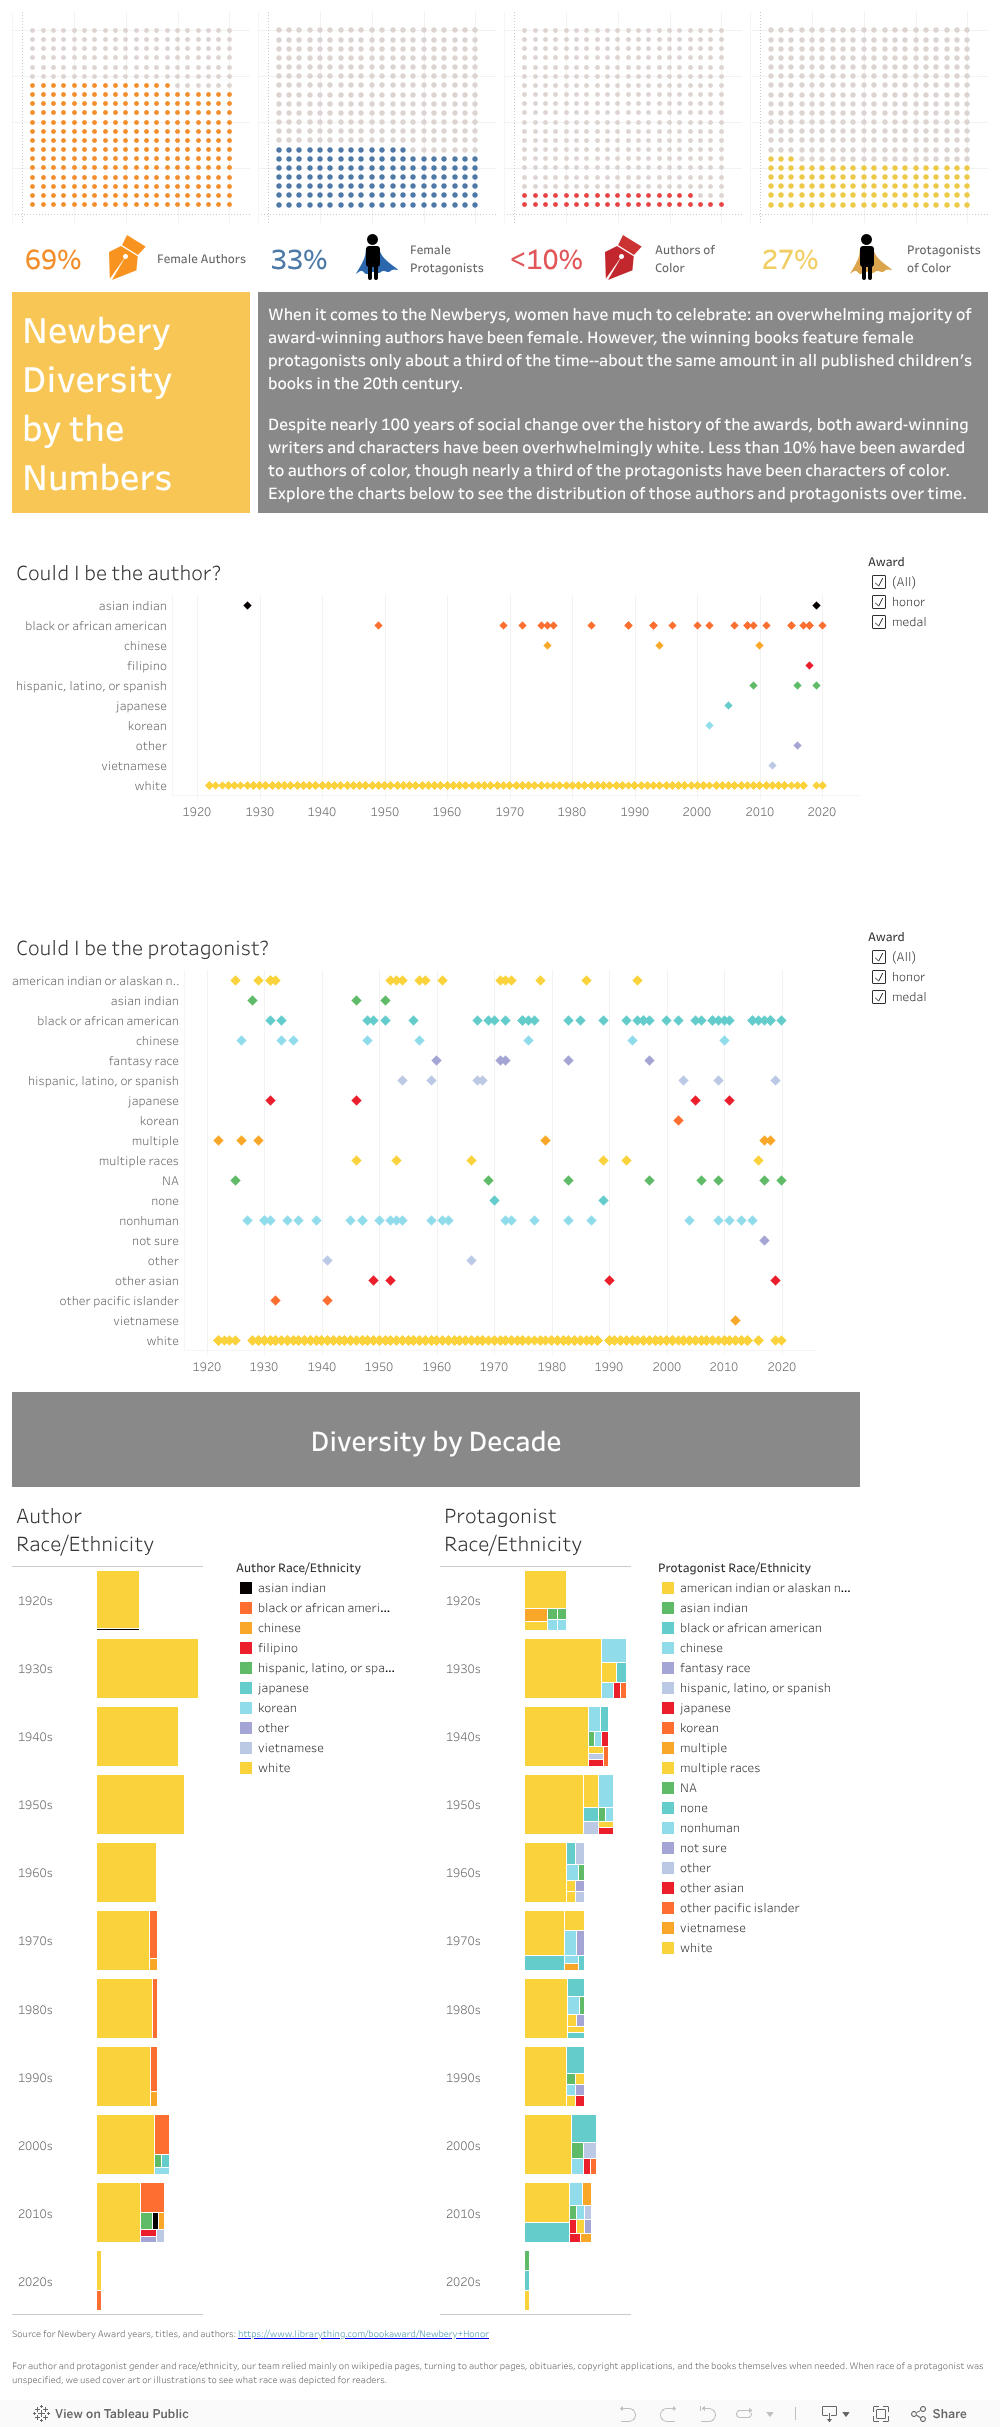
This week was all about loosening what had become a tight focus on getting required tasks done. It started with the in-class critique of our project presentation which nudged me to return to the more expansive “What if?” thinking with which we launched the project. Micki suggested really playing with the visualizations in counterfactual ways. What if we don’t represent whiteness in the graphics?* What if we push back against the census categories?

My initial play with the first question was deflating: in both protagonist and author graphs, an early award winner of color makes the removal of the “nearly solid bar” of data representing whiteness not considerably more interesting than with it. So, I’ll need to play around this week with conditional statements that sort awardees by decade or that translate our race/ethnicity data into more equitable categories than the Census divisions.

Also widening my scope was my videoconference with GC Digital Fellow Rafael Portela to review the python code I’d created to scrape Caldecott awardees. While the Newbery scrape yielded data just as I’d hoped, the two Caldecott scrapes resulted in messier .csv files that required loads of cleaning. I’d turned to Rafael (Rafa) in hopes of figuring out whether that mess was a result of the architecture of the sites’ HTML or my code.

Our meeting underscored what DH is all about: a manner of thinking more than an amalgamation of skills. Having asked me to send him the python files in advance, Rafa began by saying, “I haven’t done any data scraping with python myself.” But, he had already played with the files I’d sent, and he had looked at my code less as a data scraper than as a text parser. He asked just the right questions to get me thinking about ways my code might have been more efficient and effective.

He did indeed confirm that the sites’ HTML was what caused my Caldecott scrapes to be messy. But, he also helped me identify two ways that I might have counteracted that. First, he noted that using the element inspector in Chrome reveals a little more about the architecture of the site than merely viewing the source code. (It turns out that there was a hidden attribute in the anchor tags of the Madison Public Library site that would have helped me grab both medal winners and honorees in one go, though I still would have had a lot of cleaning to do.)

He also pointed out that using python not just for scraping but also for cleaning would have been wise. Using regular expressions to parse the data may have resulted in clean columns of year of award, title, author, and illustrator (if different from the author). He also pointed me to Beautiful Soup’s documentation to consider ways to handle multiple attributes of scraped tags in the future.

If our group has time or if we continue the project beyond the scope of the semester, I’m hoping to try using regular expressions to parse scraped data in code rather than relying on Excel’s text-to-columns feature and a lot of post-scraping work. Meanwhile, I’ll continue to do research to fix our current data set (this week, I got rid of ? and null values in the protagonist data), and I’ll start to push our visualizations further as Georgette and Emily finish up the Caldecott research.

*Actually, Georgette had suggested this in last Sunday’s team meeting, so it was a double nudge from Micki.

Newbery Group Update

During our group meeting, the team discussed how some areas of our project need attention. We realized that with the expansion of our project, we put some tasks on the back burner, and will use the next two weeks to work on them. One area we will work on is outreach, particularly our social media accounts. After seeing how effective Heritage Reconstructed was with their Twitter account, we realized that we were hesitating to fully dive in and limiting our reach. Although we are not yet ready to share our visualizations with the public, we do need to build an audience that knows what our project is about, and is eager to see our work. With that in mind, we will continue sharing content from authors, libraries and similar projects but will also work on engaging our audience with original content. We can have discussions about their children’s favorite books as well as theirs from when they were kids, or who is their favorite children’s author now. We will also blog about the project itself, our recommendations for diverse books, and special features.  

Since we expanded the project, we need to update our website to include the history of the Caldecott, and remember to create connected content on social media. During this week, we are collecting identity information on the 345 Caldecott books. Once this task is complete, Kelly will begin to work with the data on Tableau. In the meantime, Kelly is working with the Newbery visualizations and they will soon be sent out for initial feedback from our test audience: librarians, educators, and representatives from similar projects. We’ll take some of Micki’s suggestions too, to consider how to share the data through different racial and ethnic lenses other than the census categories, which may be (fingers crossed) doable through a few if-then statements in Tableau. As we play, we’ll keep our audience in mind, trying hard to make sure that the visualizations we ultimately still stay in service to our audience of librarians, educators, and parents.

Our plan for the next two weeks: 

Emily: This week I will continue to work on the Caldecott data, working on author/illustrator and then moving onto protagonists. I will also look into helping with social media, whether that be looking for content on Instagram/Twitter that we can then reshare. I will continue to make updates to the website. Throughout these next two weeks, I will check in with the team to see if anyone will need some extra help too!

Georgette: Continue working on the Caldecott data, as well as creating new content for Twitter as mentioned above. I will also reconnect with my contacts from the Diverse Book Finder and Cooperative Children’s Book Center and ask if they would consider being part of our test audience for the Newbery visualizations. 

Kelly: Updating and playing with the Newbery visualizations. Seeking feedback from parents, Steve Zweibel, and Meg’s contact at the NYPL. Meeting with whatever GCDI fellow responds to her request for a meeting about why the python scrapes have sometimes gone flawlessly and other times not.

Meg: I will write two 500 word blogs and post over the next two weeks. I will also work on learning social media and set up a schedule for posting content. 

Heritage Reconstructed Group Update

At Heritage Reconstructed we are now solidly in the implementation stage of our project. We now have a static landing page that our project developers continue to build on every week. By building our own static page separately from the database hosted by Omeka.net, our team has been able to experiment with using HTML to build pages from scratch. This week especially, other members of our team who are not developers have been able to participate in those HTML discussions and learn from our developers now that we have the pages up to walk through.

Our team has done a good job creating links between different parts of our project. As you can see in the picture below, when you access our landing page, you can see our twitter feed on the right side of the page updating every time a new post is made. Then at the top of the page you can access a link to the database.

screencap of Heritage Reconstructed landing page

The focus of this week was primarily to get some of our archeological sites up to the database therefore a lot of our efforts were concentrated on evaluating the data for the sites in peril and also finding the right presentation format for the database itself. In response to the data we gathered, we made the choice to limit our selection to archeological sites and made the distinction from natural sites in peril. As Marcela explained in last week’s update, a number of the 53 sites in peril as classified by UNESCO World Heritage do not currently have digital reconstructions. If they do have them, they are not publicly accessible. The lack of virtual reconstructions in our category of interest was always a question lingering over our project. What if we couldn’t get access to the data we needed? While we always posed these questions  to our team and understood the challenges of gathering this data, this week has really pushed our research in evaluating the sites we do have, especially in setting the criteria for what it means to be in peril.  Initially we focused on war, political unrest and environmental factors, however  heavily trafficked tourism is now also considered a peril.

There are many moving parts to building the database. On the back end, our team continues to work on the Omeka.net developer interface to build the layout of the database. Since we didn’t have to build it from scratch, we used certain features available through Omeka such as the theme and the Dublin core. We discussed the best ways to display the items such as YouTube Videos and 3D reconstructions in Omeka. Once we figured out the best way to do so, we started a csv spreadsheet for the data objects and text that we import directly into Omeka.

We has recently uploaded our first batch of 9 archeological sites into the database. We started with many of the well-know archeological sites such as the Roman Colosseum and the Second Temple of Jerusalem but will expand into other lesser known sites in peril. In terms of the presentation, users can easily navigate through each archeological reconstruction by clicking on the name and opening a separate page containing all the tags and descriptive details about the site as well as the embedded or linked digital reconstruction. As we go through the data, we will be putting up more and more sites and improving where we can on the user experience.

screencap of heritage Reconstructed database

So far we have remained on schedule with our tasks thanks to our constant check-ins. From the beginning we established a good system of task delivery and communication through basecamp and google drive. One thing we’re thinking about, as Micki suggested is to find a way to visualized what is absent in terms of the sites in peril that do not have digital reconstructions.


Kelly’s Reflection: Week of 3/23 – 3/29

As our group continues to do its research, a data story is emerging: children’s book awards can be beneficial, providing exposure and longer shelf life to quality books, but with that power, they can neglect important voices and provide longer shelf life to societal inequality. This week, I focused on how we might start to tell that story of our data through visualizations.

Two weeks ago, I created a set of four waffle charts about the Newbery Awards that statically celebrate* one extreme (the number of female authors at nearly 70%!) while exposing the shocking other extreme (that less than 10% of authors were people of color). So, this week’s task was to think about what our audience would want to see next. Perhaps they might want to dive into why female authorship is so high. Has authoring children’s books been considered largely a motherly, and therefore gendered, office? Have societal roles provided women more experience selecting and reading children’s books, thereby giving them an edge and a path into the market? Were selection committees more female than male? If female authorship is so high, why are protagonists only 30% female? All of the questions seemed interesting, and I did some research to see if there may be a compelling reason to find and present data to answer them.

The research was pretty fascinating. Perhaps my favorite find was that the selection committees seem to have been exclusively female until 1964, when Spencer G. Shaw, an African-American male librarian, entered the scene and continued to sit on the committee for four years. He seems to have opened up the committee to male participation, though that body of deciders remained largely female, even up to 2020.

Another highlight of my research was a 2011 study from Florida State University focused on a far broader selection of children’s books published throughout the 20th century. Its findings confirmed that the Newbery awardees, at least in terms of the gender of the protagonists, mirrored larger children’s book publishing trends as well as trends among other media, such as cartoons. Among the study’s many interesting finds, a news summary about the study shares that “males are central characters in 57 percent of children’s books published per year, while only 31 percent have female central characters”—nearly the same ratio in Newbery Awards. The study itself also affirmed the purpose of our investigation, noting: “Adults also play important roles as they select books for their own children and make purchasing decisions for schools and libraries…Therefore combating the patterns we found with ‘feminist stories’ requires parents’ conscious efforts. While some parents do this, most do not” (219).

But, since women already comprised the majority of authors and female protagonists were at 30%, I thought the racial disparity might be the more important next step. More than questions about gender, I thought readers might be eager to understand more deeply the startling statistic about authors of color.

I assumed that the first question on our users’ minds might be whether authorship has gotten more diverse over time, so I created a visualization to answer that question. I included a filter so that our users could determine if there was more author diversity in the Honors, as opposed to the Medals themselves, and I added information in the tool tip to help users identify quickly the specific books and authors represented by each data point—hopefully to promote the books by authors of color. Those tool tips also offer additional race/ethnicity data beyond what the US census categories allow, hopefully shedding light on both the oddity of the census categories and a tiny bit of diversity within the white authors themselves (as some white authors are Jewish or come from recently immigrated families from European countries). What I think is most effective about the chart is how clearly it illustrates that the Civil Rights era changed the scene. Only two authors of color appear prior to 1969—Indian-American author Dhan Gopal Mukerji and African American author Arna Bontemps. From 1969 on, the picture is rosier for black authors (moreso than any other group of color), but the awards remain clearly and heavily skewed toward white writers. As Georgette put it during our feedback session, there’s practically a solid line of white authorship throughout the history of the awards.

For contrast, I created a graph of protagonists’ races over time—a very different constellation of data points, and one that begs the question of who has been given license to write about whom over time. Here’s how it looks right now:

(Or, explore it on Tableau Public.)

Tonight, my group provided helpful feedback, and, after I make some changes, we’ll start to get outside critiques this week. I’m eager to make sure that the choices we make are those that benefit our users—choices that help them decide how to let these awards inform their own selections as they pick books for their collections, students, and kids.


*While such a majority might not feel like cause to celebrate—after all, wouldn’t it be great if a fuller spectrum of gender was represented and if author gender mimicked, proportionally, society?—the Newberys were created only two years after women received the right to vote. So, we celebrate that the awards seemed to be a consistent and viable place of recognition for women in a century that was far less equitable to them. (Interestingly, the FSU study does note that the percent of female protagonists is slightly higher during years of greater awareness of women’s issues on the national political stage.)

Newbery Group Update

In our group meeting, we reported our progress on our individual tasks, as well as the work that needed to be done due to our expansion of the project.

  • The team is very happy with the overall design of the website. Emily reviewed the suggested sites and recommended we create additional pages, including pages for our visualizations and infographics.
  • Meg wrote our first blog post and will post it on the website by the end of this week. We discussed possible content for future blogs and how often we should post. Besides recommending books, we will write project updates and in-depth features. For example, a post examining how African Americans were portrayed in the Caldecott books with selected illustrations. Meg will handle blogging, although any team member can contribute.
  • We discussed the importance of a strong social media presence for our project. So many award authors and organizations are using social media right now, which makes this is the perfect time for us to connect with them and raise awareness of our project. Meg will handle our social media accounts.
  • Kelly provided an overview of the Caldecott data that she scraped and cleaned. The data suggests that there are earlier instances of diversity (in contributors and subject matter) in the Caldecott books as compared to the Newbery books. Also, several illustrators were honored multiple times so collecting identity information will be quicker than with the Newbery authors. We will follow the guidelines we set for the Newbery data when finding identity information for the Caldecott.
  • I discussed how my search for historical data on children’s publishing is faring. Besides the statistics from the CCBC, I found articles from 1965 and 1985 that includes data about African Americans in children’s books. The data from the 1965 article seems to be flawed, because the questionnaire asked for books including African Americans instead of about African Americans. For example, a biography on Abraham Lincoln was counted as a book including African Americans since Lincoln issued the Emancipation Proclamation. The data from the CCBC however is books about African Americans. I will continue my search for data, but the 1965 article could be useful for inclusion in a blog post.

This week the team will focus on the following:

Emily and I will collect Caldecott author and illustrator identity information. Kelly will go back to working on the Newbery visualizations, which we will eventually send out for feedback. Meg will create the slides for the class presentation next week and post content on our social media accounts.

Heritage Reconstructed research update


I want to reflect about what we have done in the research area since the beginning of the semester. I haven’t seen it yet in the webpage because we have our group meeting tomorrow, but I know that Ashley and Chris uploaded the first two VRs on our website, which is exciting. One of the discussions we had at the beginning of the semester aimed to define what criteria we would consider for searching and mostly for selecting what VRs will be included in our database. We knew that what is available is not a reason per se, and even if we wanted to include what is available, we needed to find a narrative that explains why this is a reason for including a VR in our database.

Our aim was to create a Virtual Reconstruction database of archeological sites or objects. Since this was still too broad, we decided to focus on archeological sites in peril due to environmental damages, armed conflict or war, lack of investment in its preservation, earthquakes and other natural disasters, pollution, and poaching. This delimitation of the scope of the sites that we include in our database is important because it gives our project a strong conceptual lens and a clear standpoint to engage our VR digital project with the VR projects already being developed by different individual and institutions: scholars in universities, people in the game industry, artists, start-ups, among others. The second discussion we had is whether we would focus on a country and region of the world, and whether we would focus on a particular historical period. We decided to leave these options open and it turn out to be a good decision, which will be explained below. The third discussion we had is whether we would include natural sites in danger, e.g., parks, besides archeological sites or objects in peril. We decided to include only VRs of archeological sites, that is, sites that required human intervention and creation, for example, architecture, art, and/or religious buildings. Once we defined these criteria, the purpose of our VR digital project became much clear for all of us, not only in a practical sense, but rather it gave us a better understanding of the project we wanted to create. We needed also a new name, which is: Heritage Reconstructed: Virtualizations of Sites in Peril.

We began by exploring UNESCO Word Heritage in danger list. The list includes 53 sites in danger and includes cultural (archeological) sites and natural sites. We only focused on archeological sites. We made a search of VRs available online country by country, using different key words to make the search. Having completed the search following the UNESCO’s list, we identified two patterns: one, there are not many VRs for the sites the UNESCO considers in danger. Second, the VRs available are about countries and archeological sites that come from the same geographical region and mostly are in danger, or were destroyed, by war and terrorist groups, e.g., Irak, Libya, Syria, and Afghanistan.

We also included VRs sites that randomly appeared in our search thanks to the work of a wise algorithm. We found VRs that are publicly available, but also VRs that were created by the game industry; by start-ups, such as ICONEM, which dedicates to the digitization of endangered cultural heritage sites; Rekrei, a crowdsourced project, which also creates 3D representations of sites in danger; and CyArc-ICOMOS-Google created five VRs of sites taken from UNESCO list, which are mostly in danger due to climate change. We still have to figure out whether we will be able to upload the VRs these organizations have in their sites in our digital project or we will have to include just the link.

As noted previously, Ashley and Chris uploaded two VRs in our website. The following task for us is to review the VRs we have collected and decide which ones we will include, and contact the organizations I mentioned before, which have many VRs on archeological sites in peril, and ask them whether they allow us to upload their VRs in our website.


Kelly’s Reflection: Week of 3/16 – 3/22

This week was all about bandwidth and RAM, both literal and metaphorical. I had trouble connecting to our class’s Tuesday Zoom session—certainly a matter of too many devices and too many programs demanding too much of a limited Internet connection in my getaway in Kentucky. I also had trouble working on the visualizations this week—certainly a matter of too many worries and too many plans to make demanding too much of a brain that would ordinarily be on spring break, my annual reboot.

So, eager not to hold my team back with my distractedness, I turned to low-level but time-consuming tasks: scraping and cleaning data. Our team is interested in comparing our current data set of Newbery authors and protagonists to data about other awards. So, I scraped the basics on the next most recognizable children’s book honor: the Caldecotts, which recognize excellence in picture books.

The scraping experience reminded me that most online python tutorials work with best-case scenarios. The videos that taught me how to scrape earlier this semester drew from huge, well-established websites (the New York Times and monster.com) to demonstrate the power of the code. The few sites offering a full list of Caldecott winners were less established, and the HTML was erratic at best. The site from which I scraped the Caldecott honorees fortunately organized those winners in lists, so I could find all <li>, but within those lists, they only sometimes embedded the title in anchor tags, and they often included manual spacing and tabs for no apparent reason. About half of the time, the books were illustrated by someone other than the author, so splitting the results by the word “by,” as I was able to do for the Newberys, got tricky. So, my code just grabbed the titles and attempted to grab authors, resulting in a two-column .csv file in desperate need of real cleaning—a far cry from the comparatively tidy results of the Newbery scrape. But that kind of cleaning—split screening the data and the original site and checking manually for errors—was exactly the kind of mindless labor I needed. Now, we’ve got the years, titles, authors, and illustrators, and already, without further research, we can see that the Caldecotts are much more diverse than the Newberys. But of course, further research is what we now need as we identify author and protagonist gender and race/ethnicity more precisely.

Another great boon this week: Meg reminded us that what we’re doing matters. She crafted an initial blog post for our website intended to remind our users that as children consume books in isolation—away from school and peers and the outside world—that parents need to make sure that those pages reflect themselves and others. If children only read from a small slice of the literature available, they will be isolated indeed. We hope our project can help parents make well-informed decisions this spring, when reading might be, in some ways, the only contact kids have with the outside world.

(On a side note, I’ve remembered this week what we learned last term in the Intro to DH class: that the data infrastructure in the US allows us access to our jobs and each other in this time of crisis in a way that few other countries’ infrastructure can. I’m wondering how we might use that access to support those without it. Thoughts?)

HR Update

Considering everything that is going on, Heritage Reconstructed has had a productive two weeks. Our site is live! Head on over to https://hreconstructed.github.io/ to check us out. In addition to our website, we are proud of the accounts we have for our project, so far. We are on Gmail – heritagereconstructed@gmail.com, Omeka – https://hreconstructed.omeka.net/, GitHub – https://github.com/hreconstructed, and of course our most public media, Twitter – @HReconstructed. I love our name, and we took hours of discussion and debate on coming up with it together, and the transition to hreconstructed is totally logical. However, that was a side effect that we didn’t necessarily consider initially and due to this, there is not 100% continuity throughout our media names. My initial thought when I noticed this was, “let’s just change our email address to hreconstructed@gmail,” but we have already started outreach. So, that would possibly be counterproductive.

The website is a conglomeration of Ashley and I’s efforts, and we, and the team, are proud of it. The site went through a couple of editions before it became the site that is live today, and through that process, Ashley and I learned, as well as, tightened our HTML/CSS skills. We were also forced to home in on what we wanted to get out of it for the project, which we are for the most part done with.

The website is written in HTML and CSS with a link to our Omeka database. We initially, included the CSS for the page within the HTML code of each of the pages, but this became daunting to change repeatedly for all the pages. So, the CSS was broken into its own page. A major reason for the CSS to have its own page was the lengthy code for our footer.

The pages of the website have a color and font scheme that is meant to replicate that of Omeka’s database. Which is the main portion of our project, with the website acting as a landing page for details of our project. There are plugins for making pages in Omeka, but we are both past and current students of Patrick Smyth. So, to push our knowledge that began in Software Design Lab is a sensible move for us. At times, its been difficult to get parts of the page to work when they would be simply rendered on a pre-built website, but having to work out the code is not only rewarding, it is able to give our page a setting that is one of a kind.

In addition to code learned through Software Design Lab, we utilized https://www.w3schools.com/ and https://webdevtrick.com for the footer. An issue we were having with the footer was that it was not responsive. The menu and body of our pages shifted when the webpage minimalized, but the footer we were initially utilizing did not. When the page is minimalized, the menu starts to stack on top of each other and our Twitter blog on the right side of our page drops below the text of the page. We looked for a footer that did the same and were impressed with the footer by https://webdevtrick.com/. Now the three panels of our footer become a list when the page is collapsed to a certain width.

For the rest of this week, we are working on a draft email that will be sent out for outreach and working on our Omeka database – which we are very excited about.

Newbery Group Update

Stage One (2/19-3/19)

  • Planning & Research: Research proper race/ethnic terms for protagonist. Research critical race theory and find articles on Newbery Awards and diversity in children’s literature.
  • Content Development: Complete the Google Spreadsheet of Author Breakdown. Complete the Google Spreadsheet for Protagonist Breakdown
  • Design: Sketch up outline of website: each page (Home, About, Methods, Data) using WordPress through Commons. Future Page Suggestions: Social Media, Suggested Reading, and Infographic.
  • Outreach & Publicity: Set up social media accounts for the project. RT news on diverse books (and other suggestions). Create an email address.

Referring to our Project Work Plan, we have met our milestones in Stage One. We researched critical race theory, overall diversity in children’s books, and found articles discussing the Newbery Awards. We completed the Author and Protagonist Breakdown of Newbery Medal and Honor Winners and are creating initial visualizations. We drafted a website and created social media accounts and an email address for outreach. (Instagram & Twitter: whowinswithbookawards; gmail: newbookaward@gmail.com.)

Since we are ahead of schedule, the team decided to expand the project to include Caldecott Medal and Honor Books in our analysis. We will finish collecting the data by next week, and will have visualizations for both Awards by the end of Stage Two (March 20-April 19).

Our primary focus this week is to scrape the remaining Caldecott data and manually collect author and protagonist identity information. We also hope to get a set of visualizations together that we feel are ready for outside feedback. We recognize that current global circumstances may slow the feedback process, so having the Caldecott data to play with will give us good purpose as we wait.

We will also post our first blog and create social media content promoting diverse award books parents can read with their children-thanks Bret for the suggestion. Regarding the website, we are researching accessibility and will make any changes necessary before asking others for feedback. This week we will look at the website examples Bret sent to determine if there are any additional pages or layouts we want to include.

A Preamble to Tomorrow’s Class Session

Hi Everyone,

One of you made an important point in an email to me that “we need to be aware that the goals we set up in February changed.” In a similar vein, Matt Gold said on Twitter this evening that we “need to … recalibrate academic expectations,” and that we can’t “continu[e] on as if nothing has changed but delivery methods.”

Let’s devote the first twenty minutes of  class tomorrow to discussing what impact the pandemic is having on us and how we should address it in our course and groups and projects. Naturally, our work plans are going to have to be updated to reflect this new reality in both ways we can predict and can’t yet foresee. The health and well-being of our class community needs to be a priority, and now is a good time to remember that while the products we produce in this class are important, the process — and above all the learning process — is what matters most.

I will convene a video-conference meeting of the entire class at 6:30 pm. We’ll meet for 20 minutes or half an hour at most and then break into our smaller team meetings for the rest of the session. Tomorrow, before class, I’ll post a link to a Zoom meeting via the Commons group. If we have trouble with that platform, we can switch to Google Hangouts.

I’m going to ask Micki to join each of your team meetings for a bit so you can consult with her. I will also join in with each group, but only so long as I’m not intruding on the important work you’re doing.

Stay well,

Bret